Work · forecasting research · 9 min read
Phantom: distributional return forecasts for 362 cryptocurrencies
I wanted to know whether daily price and volume data says anything about which coins will beat their peers over the next month. The answer is a little, and it comes with a calibrated distribution. The most useful part of the project was the audit that corrected my own headline.
The question and the model
As far as this project could tell, absolute crypto returns can't be predicted from price and volume alone (versions 3 and 4 below). Relative returns are a different question. After subtracting the cross-sectional mean each day, I asked whether there's a signal about which of 362 Binance-listed coins will do better than the others over the next 1 to 30 days. Phantom answers that with a distribution instead of a single number. For every coin and every horizon it outputs the location, scale and tail weight of a Student-t.
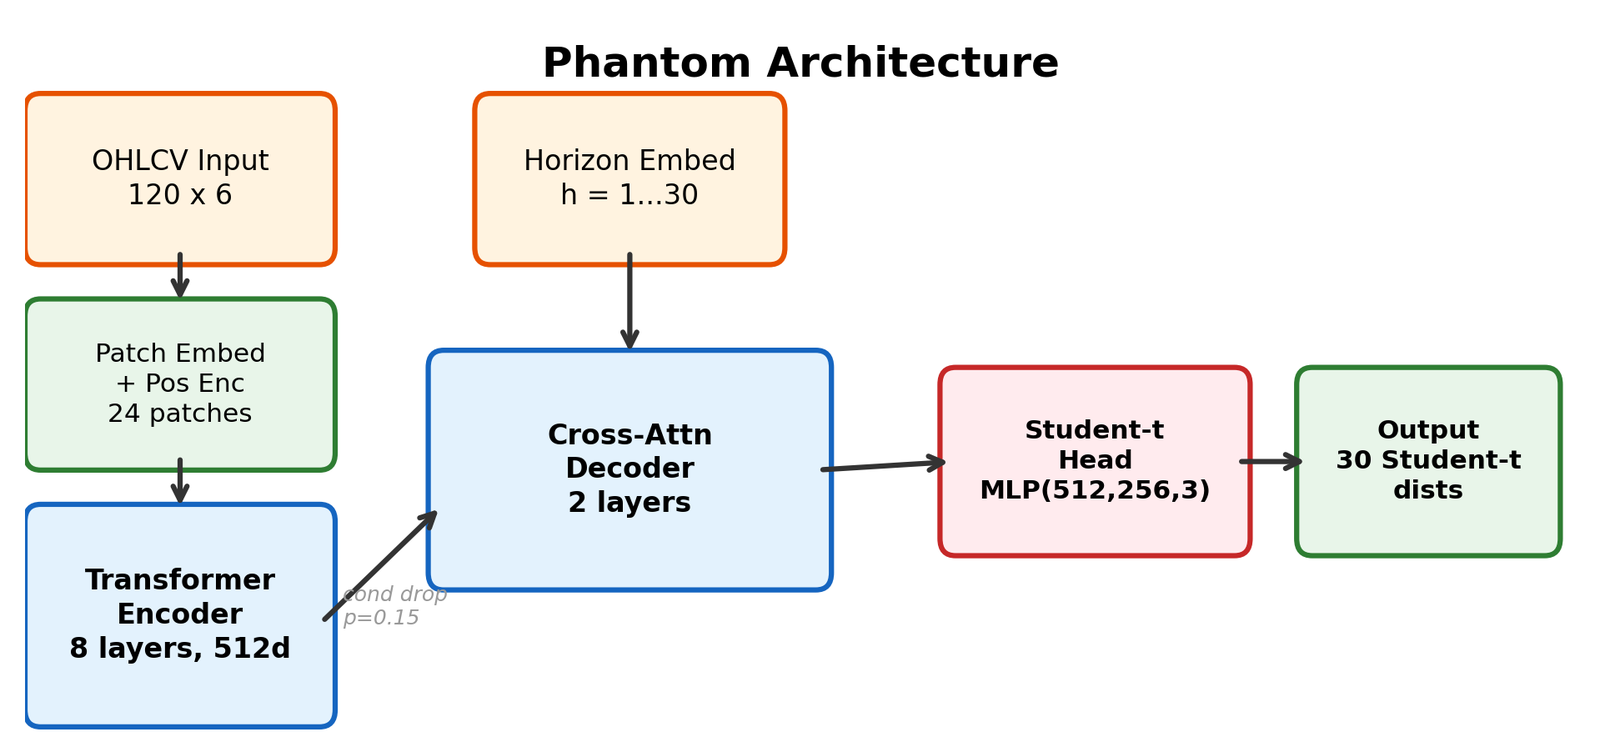
The input is 120 days of six engineered channels per coin (log return, intraday range, body ratio, log volume ratio, trailing volatility, 10-day momentum). The model cuts that into 24 patches and runs them through an 8-layer pre-norm Transformer (512 dimensions, 8 heads). A 2-layer cross-attention decoder holds 30 learned horizon queries that attend to the encoded history in one pass, and a small MLP maps each decoded vector to (μ, σ, ν).
Condition dropout at p = 0.15 and a variance penalty on the encoder stop the decoder from ignoring its input. I diagnosed that collapse during the synthetic pretraining phase (versions 1 and 2), when zeroing the encoder output moved the predicted mean by only 0.018. The loss is negative log-likelihood plus 0.5 × CRPS plus a √h-weighted mean-squared term plus the variance penalty. Training has two stages: pretrain on 413 assets across crypto, equities, FX and commodities, then fine-tune on the 362-coin universe. The model has 31.7 million parameters and trains on one A100 in bf16.
Out-of-sample results
The test window runs from January 2025 to March 2026, 144,630 coin-days over 430 dates. None of them were seen in training or validation, with the caveat that windows next to the split share up to 30 days of context. The rank information coefficient (Spearman correlation between predicted and realised relative return across coins, averaged over dates) is 0.124 at the 10-day horizon. It rises monotonically with horizon, which is what a drift signal should do against noise that grows with √h.
The sign of the signal is stable but its size isn't. IC is positive in every one of the 15 test months, between 0.036 and 0.200.
Sorting coins by the 10-day forecast gives monotonic realised returns across quintiles (Spearman 1.00) and near-monotonic returns across deciles (0.99, with D5 and D6 swapping places by 0.03 percentage points, inside their standard errors). On average the bottom decile loses 2.45% and the top gains 1.22% per 10-day window.
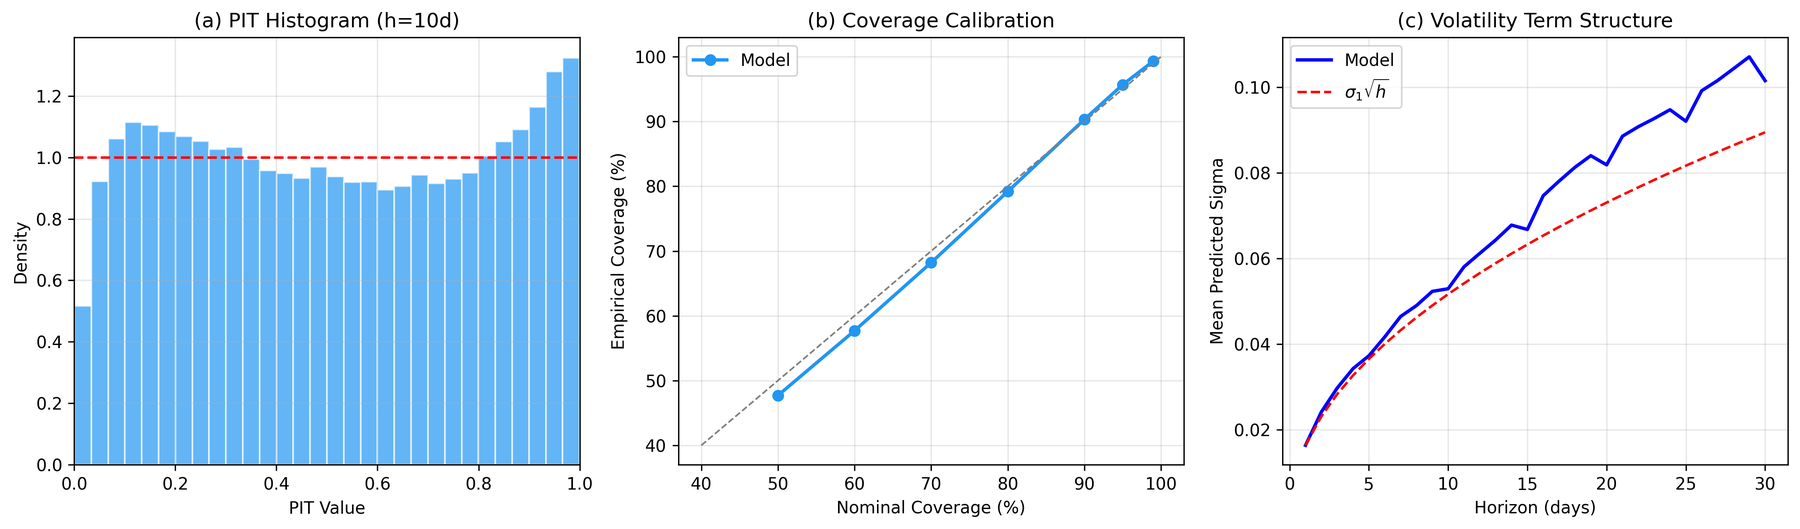
The distributional part holds up. The 50, 80, 90 and 95% prediction intervals contain 47.7, 79.2, 90.3 and 95.7% of realised 10-day returns, the probability integral transform is close to uniform, and the model drives ν to about 2. So it learned that crypto returns have very heavy tails, and priced them.
Against the baselines
Phantom has the highest IC among the directional baselines I built (momentum, mean reversion, volume, random). A naive low-volatility sort has a higher raw IC, 0.165, and is 0.63 rank-correlated with Phantom's signal. Phantom's independent contribution is significant only within the mid- and high-volatility terciles (spread t-statistics 2.6 and 4.1), and the two signals combined reach IC 0.157. The README describes it the same way.
The audit
I found this three and a half months after the release, while preparing the work for applications. The Sharpe looked too high to believe, so I audited the evaluation code and traced it to the long-short series being 10-day forward returns sampled daily and annualised as if each observation were a day. The fix in the repository is a √10 rescale of that overlapping-series Sharpe, which is equivalent up to residual autocorrelation to recomputing on non-overlapping 10-day blocks.
The same pass documented some other problems. The universe is survivor-biased (I only fetched pairs still trading in March 2026, so coins delisted during the test period are missing from training, testing and from the cross-sectional mean itself). The short leg is partly unimplementable, because much of the bottom quintile has no margin or perpetual-futures market. And the Newey-West lag I used under-corrects for the MA(9) overlap, though conservative lags still leave the IC t-statistic above 6. I corrected the README, the experiment log and the evaluation code, and left the old numbers visible as errata.
After realistic frictions I think a net Sharpe of 1 to 2 is plausible. The cost table below is the corrected one. The results figures in the repository's plots directory were generated before the audit and still carry pre-correction labels. That's why the IC, decile and baseline charts on this page are drawn from the underlying data instead of embedding those figures. The architecture and calibration figures above contain no annualised numbers and are unaffected.
| Scenario | One-way cost | Gross/net Sharpe, horizon-corrected |
|---|---|---|
| Gross | 0 bps | ≈ 4.1 |
| Standard exchange fee | 10 bps | ≈ 2.9 |
| Conservative | 30 bps | ≈ 0.4 |
| Break-even | ≈ 34 bps | 0 |
Eight versions, mostly failures
I ran the project as an ablation, and the experiment log records each version's hypothesis and result. Five of the eight versions were negative.
| Version | Change | IC (10d) | Sharpe, corrected | Finding |
|---|---|---|---|---|
| v1, v2 | Pretrain on synthetic SDE paths (GBM, Merton, Kou, Bates, GARCH) | Reached the oracle CRPS on synthetic data (0.064 versus 0.065 theoretical) but transferred nothing to real assets. | ||
| v3 | Pretrain on real multi-asset data | 0.00 | Well-calibrated uncertainty and no directional signal. | |
| v4 | Multi-horizon absolute returns | 0.00 | Memorised training directions and didn't generalise. | |
| v5 | Predict cross-sectionally demeaned returns | 0.09 | ≈ 1.5 | This unlocked the signal. It was concentrated in crypto (IC 0.144) versus commodities 0.084, FX 0.007, equities 0.003. |
| v6 | Add funding-rate and taker-buy features, fine-tune on crypto only | 0.14 | ≈ 1.7 | The features added under 0.002 IC each. The gain came from training on crypto only. |
| v7 | 4-hour bars | 0.10 | ≈ 0.8 | It did worse. Adjacent windows share 99.7% of their bars, so 476k "samples" are about 80k daily windows. |
| v8 | Widen from 60 to 362 coins | 0.12 | ≈ 4.1 | The extra breadth diversified the long-short portfolio, while mean IC fell slightly from v6. |
A binary-option test of whether it could be traded
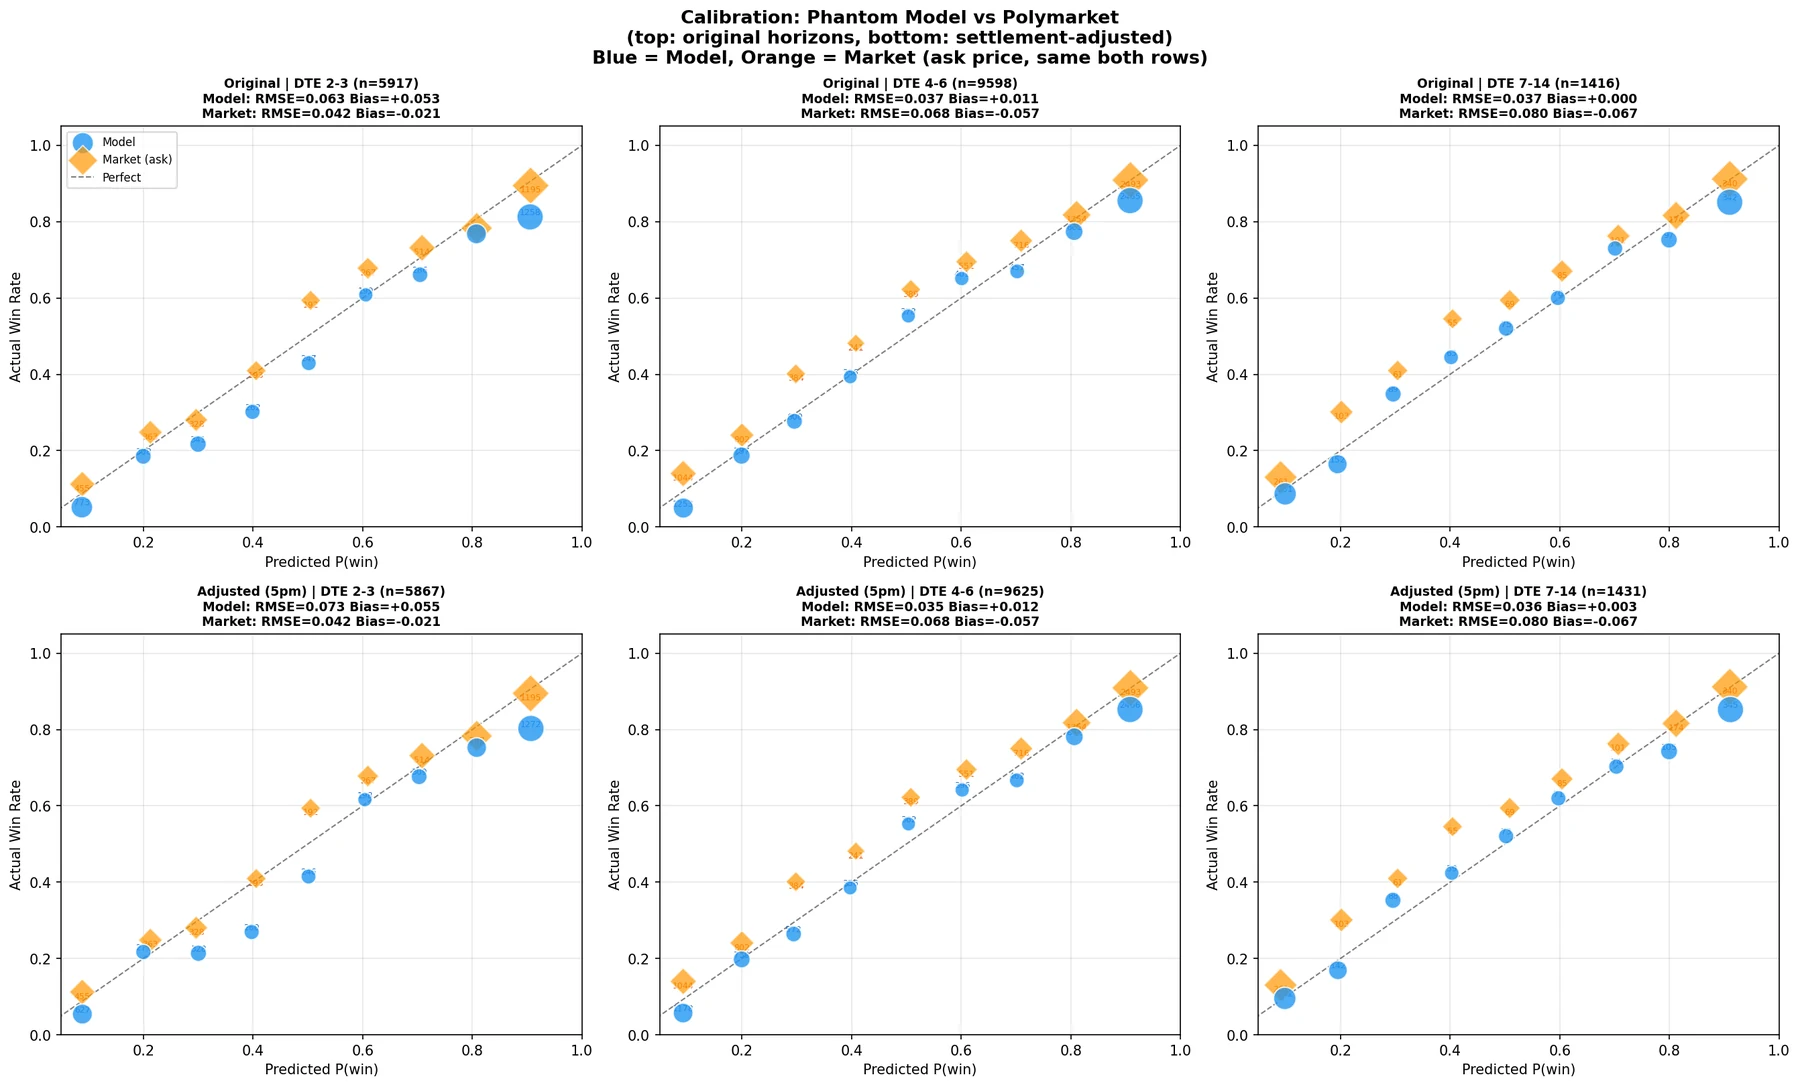
In a two-day follow-up I asked whether the same distributions price Polymarket's daily "BTC above $X" markets better than the market does. I used 7,982 resolved BTC and ETH markets from August 2025 to March 2026, with each side's price read from its own order book. At four to six days to expiry the model's probabilities were better calibrated than the ask price (root-mean-square calibration error 0.035 against the market's 0.068). At two to three days they were overconfident by about five points, which set a minimum-horizon rule.
Buying the side with edge and holding to settlement, with entry prices between 0.15 and 0.85, a 20% edge cap and ETH range markets excluded, turned $1,000 into $3,885 in the 7-month backtest (68% win rate, 1,120 trades, weekly Sharpe 2.05, drawdown −48%). The trading page quotes a delta-aware-sizing variant of the same backtest: 1,118 trades, 67% win rate, weekly Sharpe 2.2, drawdown −36%. That variant has no edge cap and ends at $3,925.
The caveats are big enough that I present this as a calibration result, not a strategy. It's one seven-month window during which BTC fell about 42% while the strategy was structurally short BTC (it mostly buys NO on "above" markets). The backtest assumes fills at the full displayed ask and values positions at cost until settlement. The most instructive caveat is an uncapped variant of the run (no 20% edge cap, $4,714 at the ask). Executed as mid-price limit orders it lost money to adverse selection, with the win rate going from 67% to 54% and the account ending at $787. I quote the capped run above because the cap is in the documented parameters.
What I'd do differently
- Fetch the universe as of each date, including delisted pairs, before training anything. Survivorship is the largest bias I haven't quantified here, and the fix is a data-collection choice.
- Evaluate on non-overlapping windows first and keep the overlapping series as the supplementary view. The √10 error couldn't have happened in that order.
- Compare against the low-volatility sort on day one. It's the obvious benchmark for a relative-return signal in crypto and it should have framed the result from the start.